In a previous blog post, we went over how to do a Gantt Chart in OneDesk. Since then, we’ve received a good question from some of our customers:
How does OneDesk’s Gantt Chart compare to Microsoft Project Gantt Charts?
The main difference between the Microsoft Project Gantt chart and the OneDesk one is that in OneDesk, Gantt Charts are automatically created and updated in real-time. They are easy-to-understand and no previous experience with Gantt charts are required.
OneDesk’s Gantt Chart allows you to do the following:
- Visually compare planned tasks and issues to how they are actually progressing, in real time
- Shorten or lengthen task duration by dragging the bars
- Create dependencies and links between tasks by dragging and dropping
- Use a dynamic slider to change the time-scale
- Easily distinguish estimated tasks via transparency
- Instantly view the critical path
- Easily view milestones
- Hover your cursor over a task to view all information about planning, actuals and completion rate
Microsoft Project Gantt Charts: Static
Microsoft Project Gantt Charts have more customizable features – you can change colors, size and shape of items in the charts and even add text to them. However, Gantt charts in MS project are static. They can’t accommodate the frequent changing requirements and tasks that product and project managers experience today. Project managers must finish all the estimates before they can make a chart in MS project; if estimates change, they must start over. With OneDesk, all project changes are dynamically and immediately reflected in the Gantt Chart.
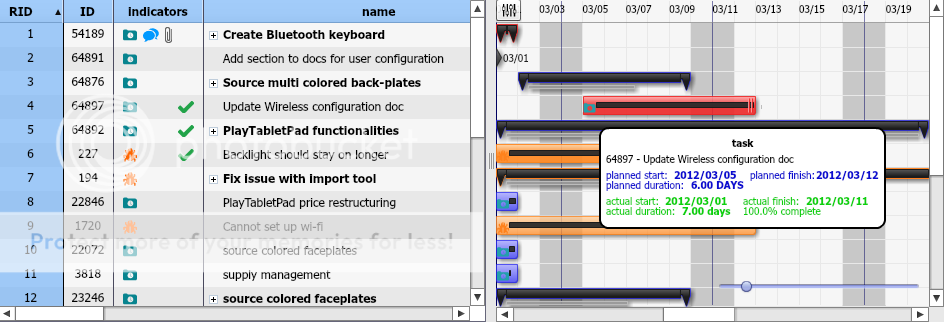
Just hover your cursor over a task to view detailed, real-time information
Related blog posts:
Identify the Critical Path Method
How to view milestones of a project in OneDesk