Reports & Report Scheduling
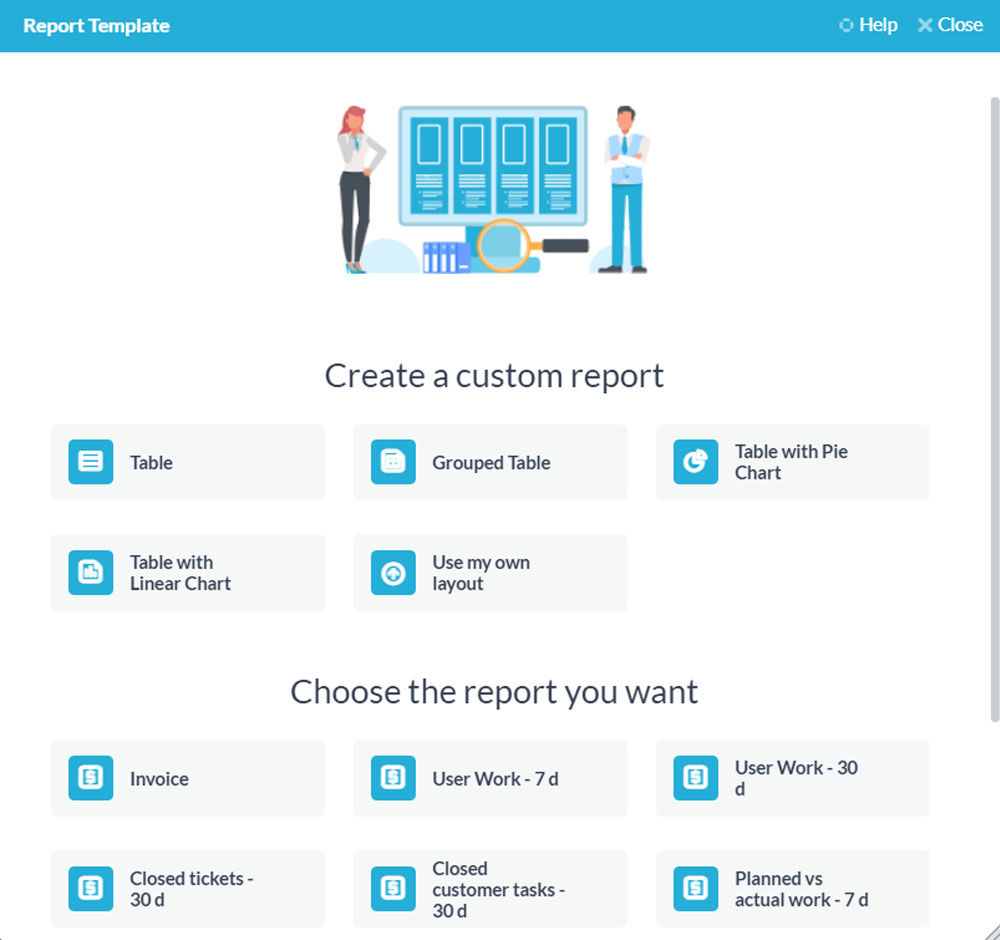
OneDesk lets you report on the progress of your tickets, tasks and projects. Stay on top of your helpdesk & project management efforts. You can customize and import your data to help you make informed decisions to further improve your efficiency.
Learn more about reporting here.
Activities
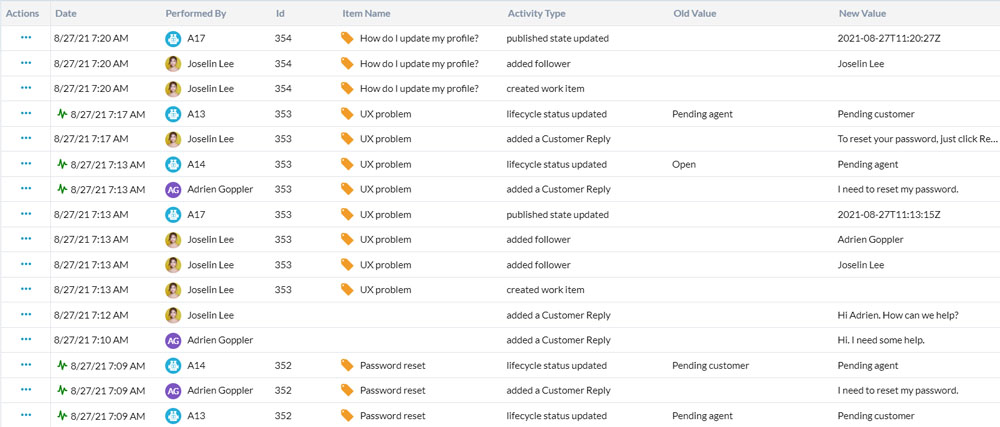
OneDesk lets you audit work with access to a full-trail transparent history of changes on tickets, tasks, and projects. Get visibility to status updates, customer communications, work automations, and more. Administrators can audit work of all activities done within OneDesk. Users can view their own activity trail as well as activities completed on an item level.
Charts
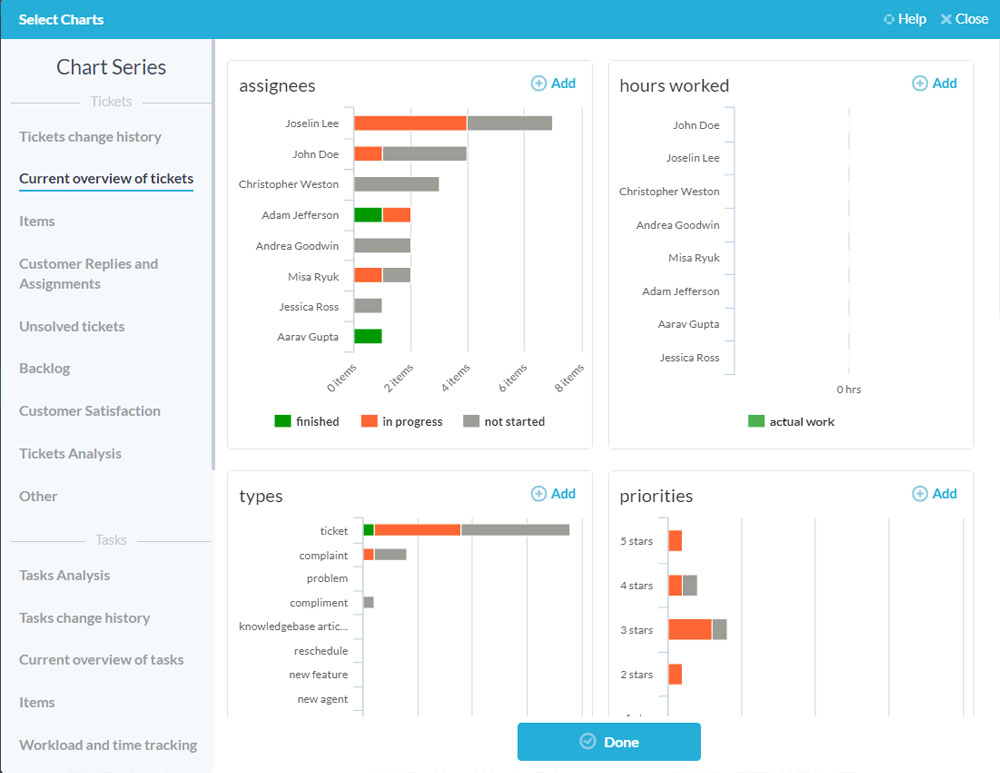
You can view your data in OneDesk as visual charts and graphs in the charts application. OneDesk allows you to create your own dashboard of graphs and charts that display data about tickets, tasks, projects, customer satisfaction, and more. The data from these charts can be exported as images or printer-friendly files.