
The new Financials application was released with OneDesk’s December 2021 update and is currently in Beta. This application is for organizations who wish to handle finances surrounding their projects, tickets, and tasks within OneDesk. The Financials application can showcase features of your items such as planned and actual cost, work, forecast revenue/expenditure, and more.
Additionally, the Financials application supports cost and billing calculations. You can set cost and billing rates on a per-level basis. For example setting cost rates on a team level, or on an individual level.
Table of contents
- Who is the OneDesk Financials Application For? Two Examples
- Accessing the Financials Application
- The Different Financials Columns
- Adding and Removing Columns in the Financials App
- Adding and Removing a Calculated Column in the Financials Application
- Changing the Date Range in the Financials Application
- Costs Rates and Billing Rates
- How Rates and Monthly Minimums are Used
- Related Articles
Who is the OneDesk Financials Application For? Two Examples
Companies that could make use of the Financials application include consulting firms, outsourced IT support firms, MSPs, and more. Let’s take a look at two examples of how companies across different fields may utilize the new Financials application.
Professional Services Firm – Easy Calculation of Billing Rates and Costs Across Teams
A consulting firm is a good example of the cost and billing calculation tool inside the Financials application. This specific firm employs many personnel or contractors spread across several teams. Individual users are paid at different rates.
It’s easy to see how calculating expenditure and/or revenue on a single ticket can get out of hand with different rates like this when multiple users are involved, let alone for entire projects and portfolios. With OneDesk’s Financials application, administrators can input the cost and billing rates for each individual employee/contractor.

Once these rates are entered and recalculated, the financials will be updated to reflect the cost associated with the work of each individual user.
Outsourced IT Firm – Organize your Finances Across Multiple Clients
As a second example, let’s look at an outsourced IT firm. The company needs to keep detailed track of their finances across many clients – all from different organizations. The Financials application in OneDesk streamlines this process by providing a convenient view for the operator to see their profit and costs. The operator can set up columns and save views such that the information which matters most to them is easily visible. For example, the operator can include columns for the planned work and cost of each item, and the forecast billable amount to forecast how much of their cost per hour will be billed to the client.
The operator of this IT firm can set up their billing calculations on a per-customer basis. As different customers will have different agreements with the operator, OneDesk’s per-customer calculation level helps to relieve the headache of keeping track of what each separate customer is paying for work done on their requested items. The customer may have monthly minimums or “retainer” set to ensure a set cost for a fixed number of hours each month.
These examples are just two of the many applications of OneDesk’s Financials app. Heavily customizable, the display and calculations of your finances can be changed to suit your needs and to work across a wide range of businesses.
Accessing the Financials Application
Administrator accounts can configure access to the Financials application through a user’s information panel. They can choose to set a user as having full or limited access. With limited access, a user cannot see the Financials application and therefore will not be privy to the finances of the organization.
To access the new Financials application in OneDesk go to the more applications section in the bottom left of the OneDesk interface, and then select the Financials app denoted by the “$”:


On the right-hand side of the screen you will see the various columns with finances pertaining to each project and the items within. These columns can be customized to your liking, and calculation columns can be added to determine on-the-fly the amount of money going into a project or item.


The Different Financials Columns
The columns that can be added or changed in the Financials application deal with a variety of potential metrics. Here is a quick overview of all the default columns and what they mean, separated by the column type.
Work Columns
- Planned Work (PW): The planned schedule of a given project or item. This can be specified as the sum of the days/hours of work allocated to each item.
- Actual Work (AW): The actual work of a given project or item. This is the total amount of days/hours worth of work put into the item to date.
- Actual Billable Work (ABW): The actual work of a given project or item that has been marked as billable on submitted timesheets.
- Estimated Work (project) (EW): The estimated work that a project will take to complete. This is a personal estimate and is optionally input when creating a project.
Cost Columns
- Planned Cost (PC): The planned cost for a project or item in dollars, calculated from your set cost calculations and the planned work.
- Actual Cost (AC): The actual cost for a project or item at its completion in dollars, based on submitted billable hours.
- Estimated Cost (project) (EC): The estimated cost in dollars that a project will take to complete. This is a personal estimate and is optionally input when creating a project.
Billable Columns
- Planned Billable Amount (PBA): The planned billable amount in dollars for a given project or item, calculated from the billing calculations and the planned work.
- Actual Billable Amount (ABA): The actual billable amount in dollars for a given project or item, based on submitted billable hours at completion.
- Estimated Billable Amount (project) (EBA): The estimated billable amount for a project. This is a personal estimate and is optionally input when creating a project.
Forecast Columns
- Forecast Work (FW): The forecast work for a project or item, based on the pace at which work is being done.
- Eg. A ticket has planned work of 8 hours. After 4 hours worth of work is submitted, the ticket stands at 25% complete. Therefore, the Forecast Work is currently 16 hours.
- Forecast Remaining Work (FRW): The forecast work that remains on a project or item, based on the pace of completion.
- Eg. A ticket has planned work of 8 hours. After 8 hours worth of work are submitted, the ticket stands at 50% complete. Therefore, the Forecast Remaining Work is currently another 8 hours.
- Forecast Cost (FC): The forecast cost for a project or item, based on set cost calculations and the pace at which the item is being completed.
- Eg. A task has planned work of 8 hours at $100/hr planned cost. If after 8 hours the task stands at 50% complete, the forecast cost is currently $1600.
- Forecast Billable Amount (FBA): The forecast billable amount for a project or item, based on set billable calculations and the pace at which the item is being completed.
- Eg. A ticket has planned work of 8 hours – 4 hours non-billable and all hours billable at $100/hr after the first 4 hours. The forecast billable amount will then be If the item is at 25% completion after the first 4 hours, then the Forecast Billable Amount is currently $1200 (4hrs per 25% complete = 12hrs from 25% to 100% at $100/hr).
Adding and Removing Columns in the Financials App
If you would like to change the financial information that is immediately viewable in the Financials application, select the cog-wheel beside the “Actions” menu on the left. Scrolling down, you will see columns to add or remove dealing with financials and calculations:

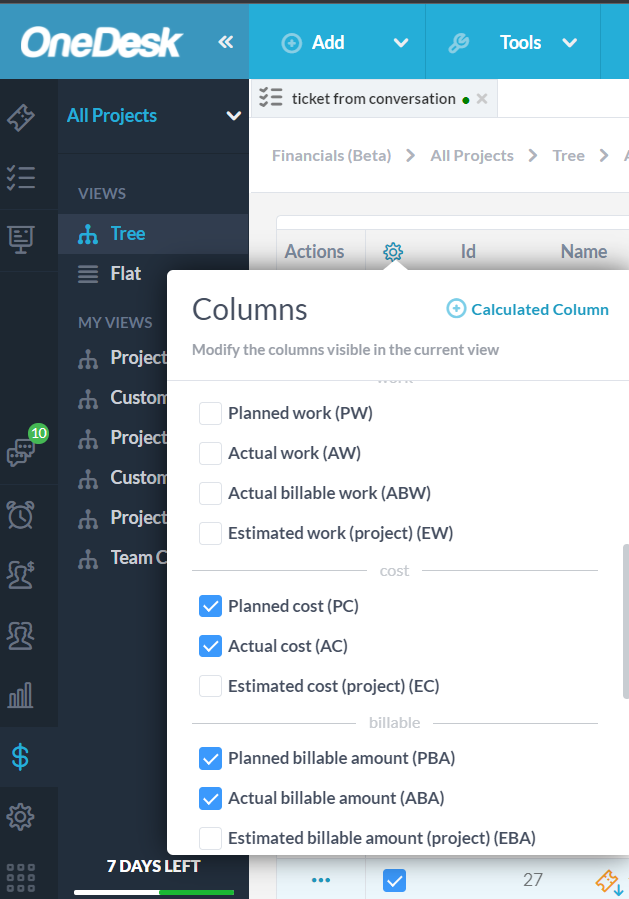
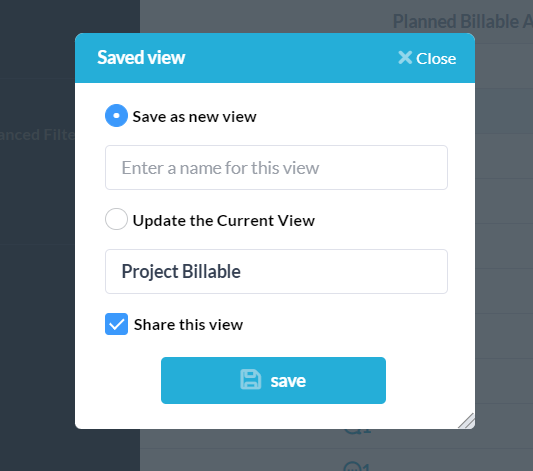
Check a column to add it to your view on the right, or uncheck a column to remove it. You can personalize the way your company’s financials are displayed in many ways through the columns that are available. Once done, you can save and/or share the view by selecting the edit pencil next to the view’s name -> save -> share this view.

Adding and Removing a Calculated Column in the Financials Application
In addition to the default columns in the Financials application, you can create calculated columns to subtract the values in other pre-existing columns. To create a calculated column, select the cog wheel on the left-hand side of the Financials application, and select the “+” to add a calculated column.


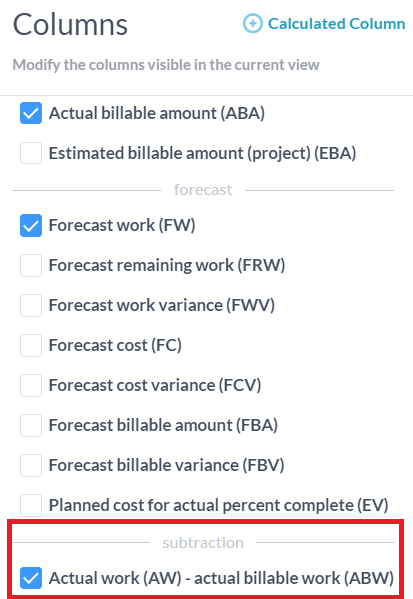
On the resulting menu, you will be prompted to select the properties which you wish to subtract. Depending on your selection for the first property, the subtraction property will change. For instance, if we select Actual Work as our first property, we can choose between Forecast Work and Actual Billable Work to subtract.


Let’s select Actual Billable Work and add the column. Now a column will appear in our view titled “AW – BW”.


Additionally, you can now choose whether to show this column or not from the cog-wheel menu. Please note that removing this subtraction column will delete it and it will need to be added again manually if you wish to see it.

Changing the Date Range in the Financials Application
The Financials application also supports the option to change the date range in which you view your financial information. Inside the Financials application, there is a date range selector directly between the breadcrumbs and the search menu.

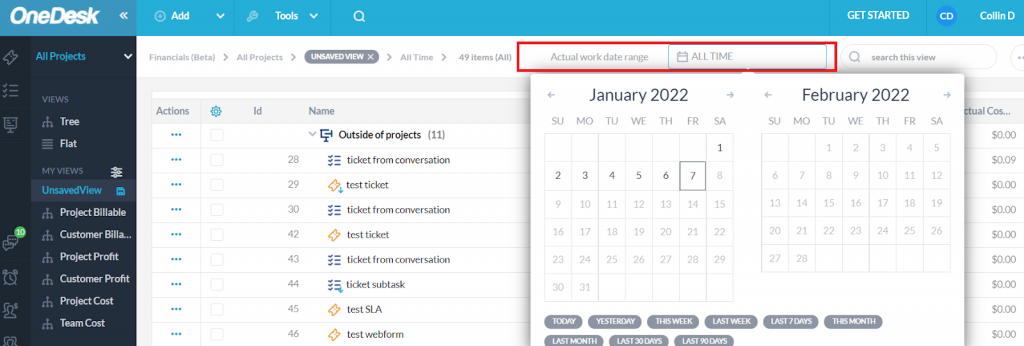
From this menu you can choose from several preset date ranges from the options at the bottom, or specify your own custom date range by selecting a date in the past and moving your cursor to the next desired date.


Once a date range has been selected, you will only see information relevant to items which have been worked on in that time period. With no date range chosen, all items will be visible regardless of the date they have been worked on.
Costs Rates and Billing Rates
OneDesk’s Financials application allows you to change the cost and billing rates on a per-level basis. These rates can be changed to best reflect the flow of money into and out of your business as you work on your projects, tickets, and tasks. Read on below to find how to change these rates, as well as a few examples of use-cases for different industries.
Editing Cost/Billing Rates
To change the cost calculations and billing calculations, select the actions menu on the left side of the Financials application, and the “edit cost/billing rates” option to appear at the following menu:


This menu allows you to change the level at which you calculate your costs and billable amounts. You can choose from several calculation levels for both cost and billing calculations, shown below:


You should set the Cost Calculation level to the level at which cost-per-hour varies.
You should set the Billing Calculation level to the level at which your billed rate per hour varies.
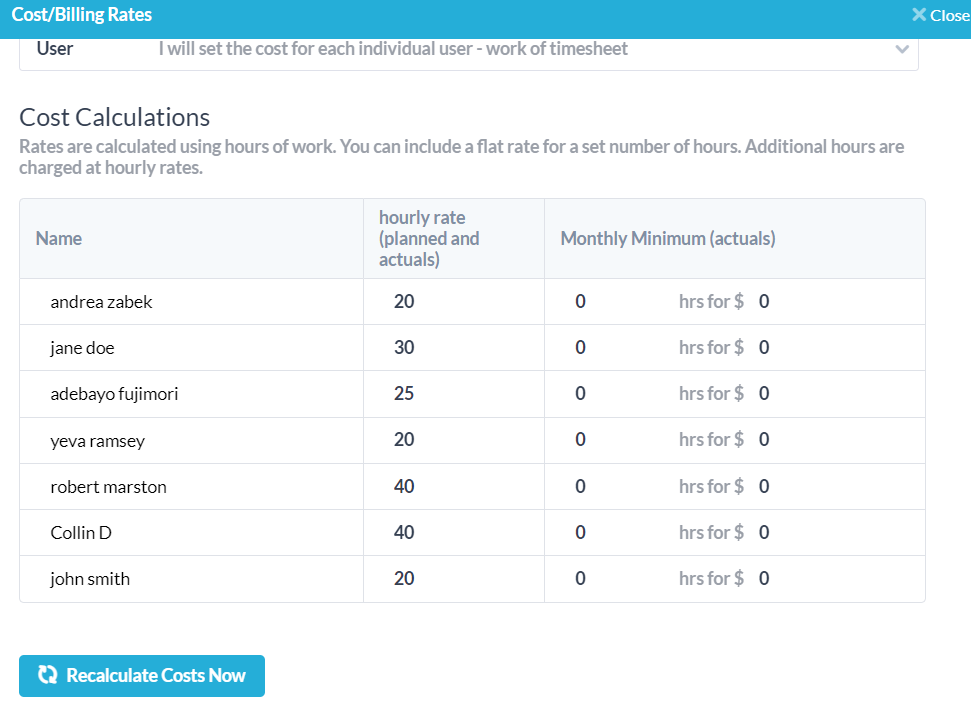
Depending on what calculation level you choose, your options will change. If we go on a per-team basis to calculate billing, then we would specify different hourly rates and monthly minimums for different teams. If we went on a user rate, we would specify different billing rates and monthly minimums for each employee.


Once billing amounts have been changed, pressing the “recalculate” button at the bottom will automatically adjust all rates without any additional work on your part.
The Cost and Billing Tool: A Few Examples
The ability to change cost and billing rates for different levels in your organization and for your customers allows you to keep track of your finances directly through OneDesk and further streamline your workflow.
Software Company with Different Per-Team Payment Levels
Let’s use an example of a software company which has various teams of contractors working on its software. There are also teams who field specific questions from potential customers and are occasionally asked to work on projects on a contract basis. Depending on the project, ticket, or task’s priority, members of different teams will be assigned – each of which has a different pay level.
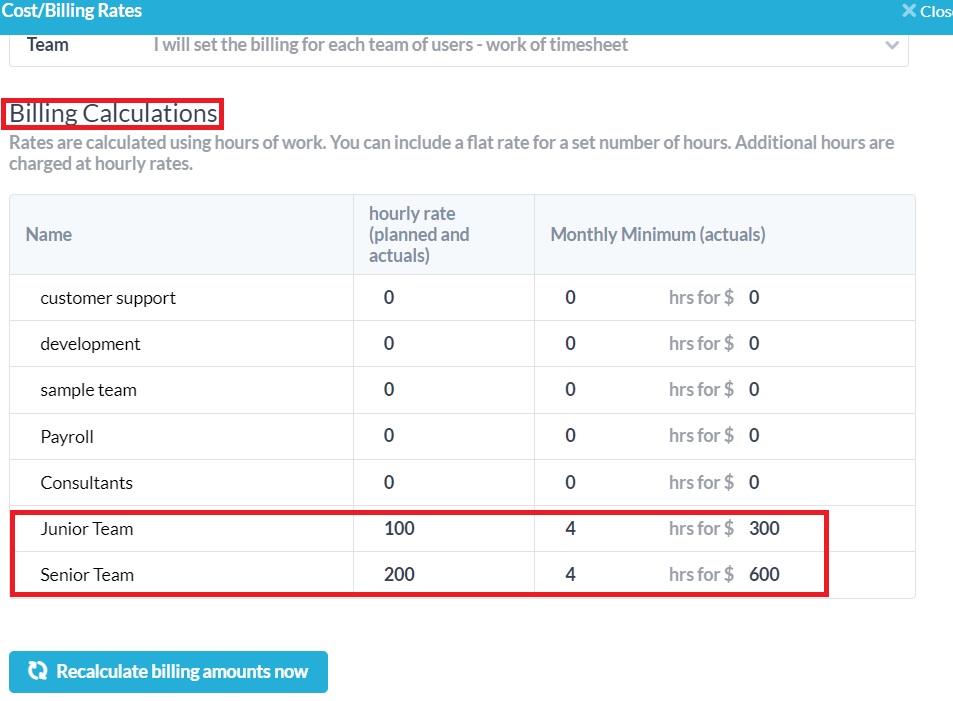
As an example of the way this company could set up their cost and billing rates, say they have a junior developer team and a senior developer team. The junior developer team members get paid $25 per hour by the company, and are billed-out to clients at $100 per hour for their work. The senior developer team is paid $50 per hour and are billed-out to clients at $200 per hour, respectively. Both teams have agreements to work the first 4 hours of labour for any client at 75% of billable cost (eg. Jr team’s first 4 hours total $300 instead of $400 for the client).
Therefore, in the cost and billing calculation tool, the administrator will input the cost of the two teams on the team-level as $25 and $50.


Then, the billing rates will be $100 and $200 with minimum 4 hours of work for $300 and $600 respectively.

The administrator can then simply press the recalculate button to easily calculate their expenditure and revenue on all items that these teams are assigned to.
Outsourced Support Centre with Many Employees and Clients
For this second example we have an outsourced support centre. The centre has well over 100 employees who work on client requests across several organizations. The support centre guarantees each client hours of exclusive support per month at a flat fee which is agreed upon with the client:. Each client has unique deals with the call centre, so billing rates are different depending on the customer organization and their needs.
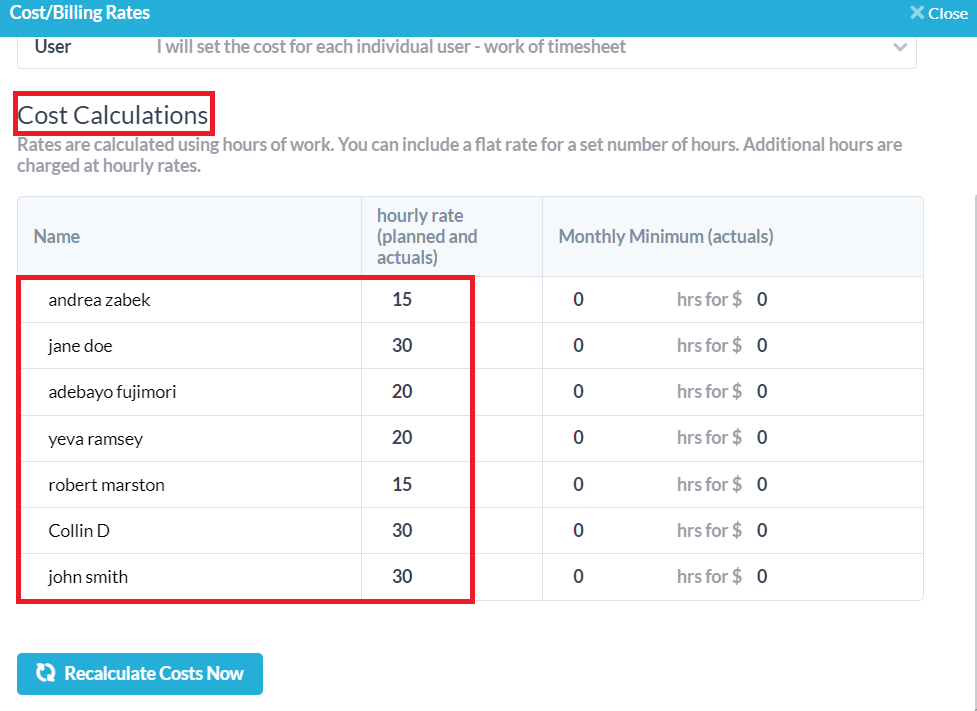
Each agent in this support centre is paid depending on their seniority. New hires (< 1 year) make $15/hr, junior employees (1-5yrs) $20, and senior employees (5+ years) make $30/hr.
As each team includes agents of varying seniority levels, the administrator of the support centre’s OneDesk account would select their cost calculations on the individual user level:

Since each client has a different arrangement with the support centre, their billing rates will need to be entered differently. Say for example out of three clients one client is billed at $100/hr, another at $200, and a third client at $300 per hour. The minimums for the clients are 15 hours for $1000, 20 hours for $3000, and 25 hours for $6000. Once the time for the monthly minimum has been exceeded, the clients pay the hourly rate.
Our billing calculations will look something like this once the monthly minimum is also applied:


The administrator can then recalculate these amounts to determine their revenue and expenses across the entire support centre and its clients.
These examples are just two scenarios of why the cost and billing rates tool may be useful. The Financials application in OneDesk provides the functionality for companies from many fields to quickly and easily determine their cash flow.
How Rates and Monthly Minimums are Used
An important distinction to make when using the cost and billing calculator is how rates and monthly minimums interact with each other and specific values, especially 0 values and blank fields. Here are the interactions of these fields depending on what values are used:
- Both hourly rate and monthly minimum (hours and cost) have values (non-zero and non-blank): The monthly minimum value will be used until the allotted time is up, at which point the hourly rate will apply.
- Eg. A contractor is paid $500 for 10 hours minimum of work per month, with an hourly rate of $75.
- If their total work to finish is 20 hours, the first 10 hours will cost $500, and the last 10 will cost $750 for a total of $1250.
- If their total work to finish is 5 hours, the cost will still be $500 (the minimum)
- Eg. A contractor is paid $500 for 10 hours minimum of work per month, with an hourly rate of $75.
- Hourly rate is non-zero and non-blank, monthly minimum (hours and cost) is zero or blank: The hourly rate applies at a flat rate.
- Eg. An employee works part time at a variable schedule. They are paid $20/hr with no monthly minimum. If they are scheduled for 20 hours a week, they will earn $400 that week.
- Hourly rate is zero or blank, monthly minimum (hours and cost) has a value (is non-zero and non-blank): The worker will be paid the monthly minimum, regardless of hours worked, while the customer does not pay more than the specified value.
- Eg. An agent has an on-call tech support agreement with a monthly minimum set at 10 hours for $1000. If the hourly rate is set to zero but the monthly minimum is filled, then the agent will be paid $1000, regardless of the actual work done by the agent this month.
- This works both ways – the agent gets paid $1000 per month for 10 hours, regardless of if they actually worked 11 hours or 9 hours, for example. The customer will not pay more than $1000 per month no matter if the agent works overtime.
- Eg. An agent has an on-call tech support agreement with a monthly minimum set at 10 hours for $1000. If the hourly rate is set to zero but the monthly minimum is filled, then the agent will be paid $1000, regardless of the actual work done by the agent this month.
- Hourly rate is zero or blank, monthly minimum dollar amount is non-zero and non-blank, monthly minimum hours are zero or blank: The cost/billable minimum amount is accrued to the employer/client, regardless of work performed, applicable as soon as service is agreed upon.
- Eg. A minimum is entered for $200 for a plumber. As soon as the plumber receives a call from a client and shows up at their home, the client is charged $200 for whatever job the plumber performs, regardless of if the plumber has actually done any work or not and how long the job takes.
- Hourly rate is zero or blank, monthly minimum dollar amount is zero or blank, monthly minimum hours are non-zero and non-blank: The entered minimum amount of hours worked per month are expected to be completed at no cost to the employer and/or customer.
- Eg. A lawyer agrees to provide 10 hours of pro-bono work to a client per month. Their monthly minimum will thus be 10 hours, with no minimum cost or hourly rate attached.
- Both hourly rate and monthly minimum are zero and/or blank: The service will be treated as free with no attached costs and/or billable amount – no monthly amount of work will be implied either.
Also note that the level at which cost and billing rates are calculated is the framework in which all these calculations are possible. Finding what level is most applicable to your specific situation is the key to getting OneDesk’s Financials application running as smoothly as possible.