The analytics dashboard in OneDesk can be used to quickly view performance indicators and relevant charts for your organization. This dashboard can be configured to easily show the charts and date ranges which are most relevant to you and your business.
Accessing the Analytics Dashboard
To access the analytics dashboard, head to More Applications -> Analytics > Charts. At this screen you can see a wide variety of charts which are set up by default.

The chart series can be changed with the dropdown menu in the top-left, while the date range can be changed in the top-right. Selecting the hamburger menu in the top-right of each chart allows you to print the chart or download the chart as a variety of image formats.
Certain charts can have multiple displays – indicated by a dropdown menu for their title:

This dropdown will allow you to fine-tune the information that the specific chart is displaying. For example, “Time since tickets created” can change to “Time since tickets updated” via this dropdown menu.
Creating a Custom Analytics Layout
If there are charts from different default chart series which you wish to view side-by-side, or wish to declutter your view from irrelevant metrics, you can create a custom analytics layout.
To create a custom analytics layout, select the “+” when hovering over the “My Views” heading on the left-hand side of the screen. This will bring you to the custom view creation screen.

Select “Add Chart” to select from all available charts for your custom dashboard.

Selecting the add button places the respective chart into the otherwise blank dashboard. The charts will appear in the order they are added.
Additionally, you can add in specific filters by selecting “Add Filter” as needed. When done with the custom layout, select save and you will be prompted to name your layout and share it with other users in your organization if required.
Example: Industry-Specific Analytics Layout: IT Helpdesk
As an example of what an ideal chart layout would be for a specific industry, let’s look at an IT helpdesk which is servicing customers’ tickets from inside OneDesk.
Ticket analytics for an IT helpdesk should include the following:
- Average response time by users for tickets
- Average ticket resolution time
- Assigned tickets by user and ticket status
- Hours worked by assignee
- Status of ticket by priority
- Unsolved tickets by user
This dashboard will provide an IT helpdesk with a good overview of their day-to-day operations from a single place in OneDesk. The helpdesk administrators can look at these analytics to view at a glance how efficient the team is being, what the team’s workload is looking like, and what tickets should be prioritized over others.
Adding these charts to a custom layout, the IT team can now quickly call these charts up from the left-hand side of the analytics application.

The team can then make multiple views which cover different aspects of their operations more in-depth. For example, a separate view could deal entirely with unresolved tickets as opposed to this general view.
Who Can View the Analytics Application
Certain performance metrics may not be wished to be visible to all users in your organization. If you are an administrator and wish to restrict the usage of the analytics application to certain users, go to more applications -> users -> user detail panel, and scroll down to permissions of the non-administrator user whose permission you wish to change.
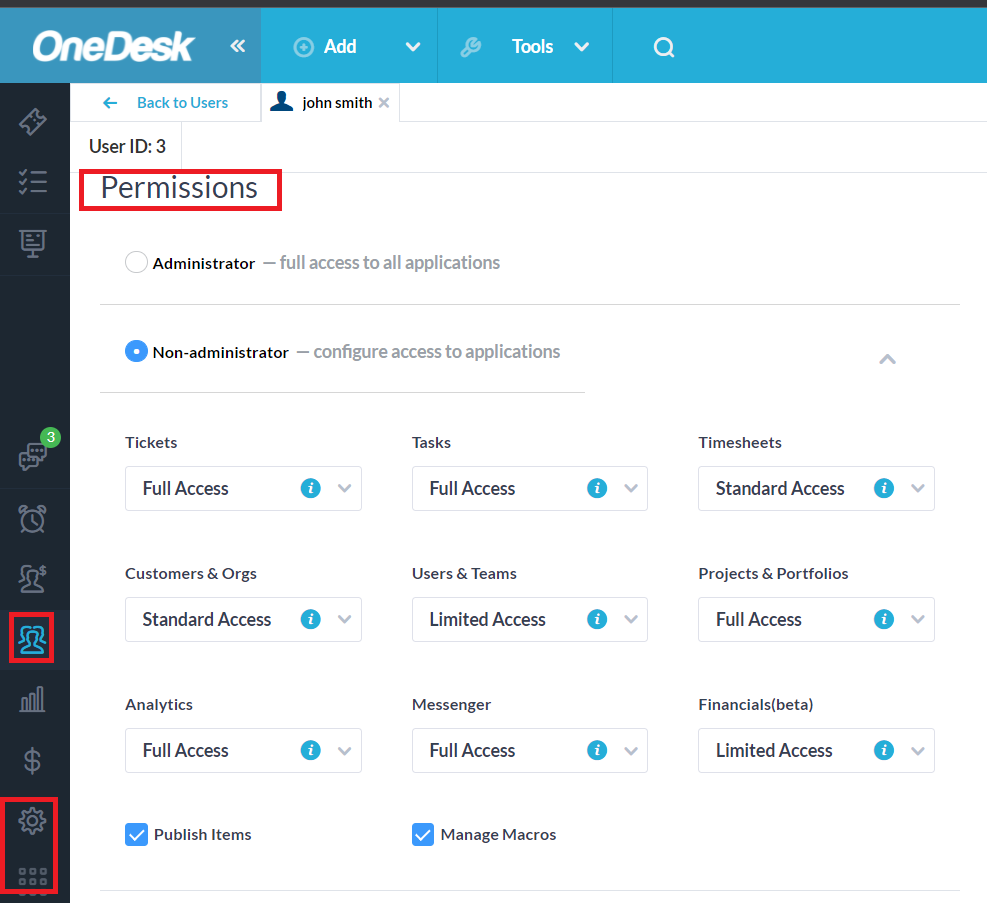
Administrators can change a non-administrator user’s access to the Analytics application between limited and full access. Limited access will hide the Analytics application from the non-administrator user.